
The Current State of Ethereum
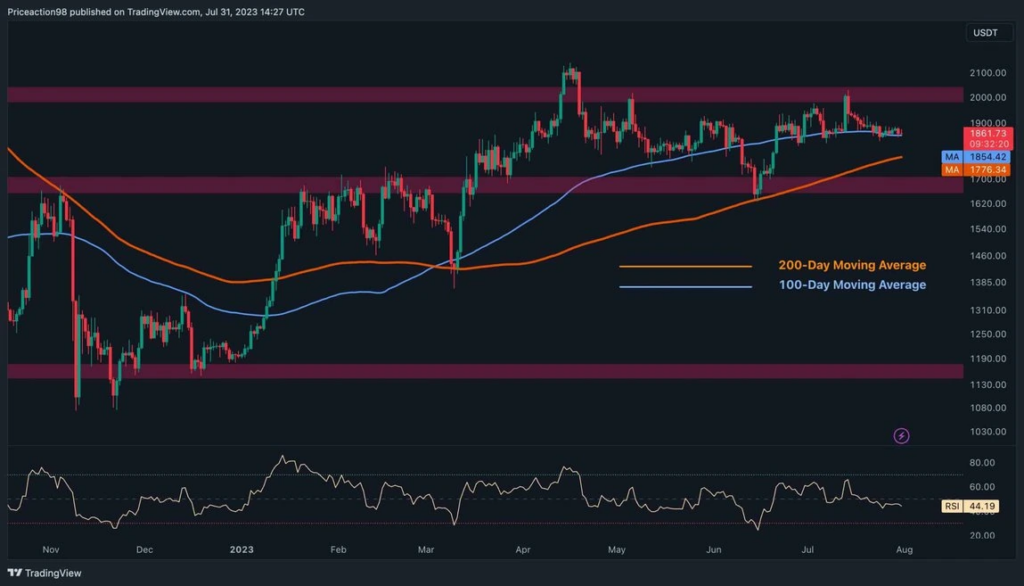
Ethereum, one of the leading cryptocurrencies, has been exhibiting a flat price trend, hovering above the $1.8K mark. Despite multiple attempts, the digital currency has been unable to break the crucial resistance level at $2K, suggesting a lack of demand. This steady state of Ethereum’s price has been maintained by the 100-day moving average, which has successfully prevented further decline for several months.
The price faced rejection after the third attempt to break through the $2K resistance region within the last month. This rejection coincided with a decline in bullish momentum, attributed to increased selling pressure around that level, resulting in minor rejections and relatively stable price action.
A Closer Look at the Technical Analysis
The 100-day Moving Average (MA), currently at $1,854, has consistently provided support and prevented further declines over the past few weeks. The breakout from the significant price range between the 100-day MA and the $2K resistance level will likely play a crucial role in determining Ethereum’s prospects in the mid-term.
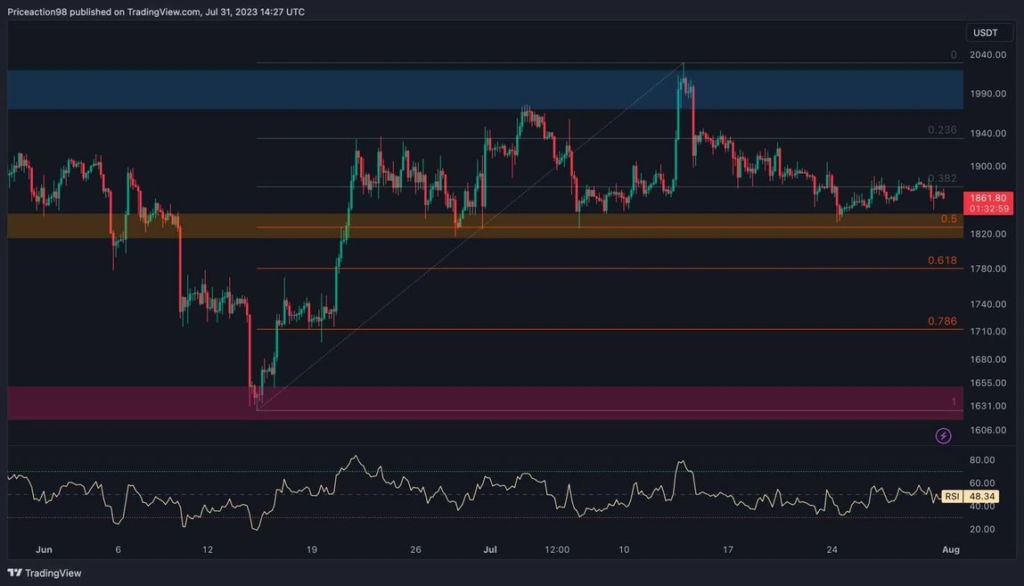
On the 4-hour chart, Ethereum experienced a bullish rally in mid-June, leading to a test of the major resistance at $2K in mid-July. However, it is now facing the 0.5 Fibonacci retracement level at $1827, which serves as significant support for the price.
Ethereum remains trapped between two critical price levels: the static resistance at $2K and the critical support at $1,850. This suggests the possibility of a range-bound market characterized by consolidation candles. The price seems more likely to continue trading within this range until a breakout occurs, providing insight into Ethereum’s upcoming direction.
My Perspective on the Situation
From my point of view, the current stability of Ethereum’s price, while seemingly uneventful, could be the calm before the storm. The inability to surpass the $2K resistance level might indicate a lack of demand, but it also shows a strong support level that has prevented further decline.
The range-bound market, characterized by consolidation candles, suggests a period of accumulation. As I see it, this could be a sign of a potential breakout in the future. However, it’s important to note that a breakout could swing either way – a surge above the $2K resistance level or a drop below the $1,850 support level.
The 100-day MA and the 0.5 Fibonacci retracement level are acting as significant support levels for Ethereum’s price. If these levels hold, we might see a bullish trend in the mid-term. However, if the price breaks below the 50% Fibonacci level, the next potential stop for Ethereum could be the 61.8% level at $1780.
In conclusion, while the current stability of Ethereum might seem uninteresting to some, it could be a significant indicator of a potential storm brewing in the cryptocurrency market. As always, investors are advised to conduct their own research and make investment decisions based on their risk tolerance and investment goals.